-

-

-

-

-
Copy to clipboardLink Copied


Contents
- Executive Summary & Business Tip
- Market Trend
- Spotlight
- Ocean Freight Updates
- Air Freight Updates
- Customs, Inland Transport, Terminal & Regulation Alerts
Executive Summary
Global freight markets close out 2025 in a state of managed volatility. After a 17‑week decline in major container indices, a small rebound has emerged, driven more by GRIs and blank sailings than a recovery in real demand. Underneath, structural overcapacity is building for 2026 as new vessels continue to enter the market, even while geopolitical uncertainty, tariff resets, and shifting trade flows keep shippers operating in an unpredictable environment.
Across Asia–Oceania lanes, conditions remain mixed. North East Asia to Australia has swung from early‑November firmness into sharp mid‑month corrections, with significant discounting on budget services but premium loops holding higher levels. South East Asia appears steadier, though congestion in Singapore and Port Klang is quietly tightening effective supply. Airfreight enters year‑end with “selective tightness”—rate pressure emerging on key lanes despite uneven demand—making uplift prioritisation and mode planning essential for time‑sensitive cargo.
Globally, traditional trade patterns continue to shift. Intra‑Asia rates are climbing in the lead‑up to Lunar New Year, upstream costs are rising for Oceania importers reliant on regional feeders, and a cautious re‑entry into the Red Sea hints at major network recalibrations ahead. A large‑scale return to Suez routings would likely trigger short‑term congestion before reinforcing downward pressure on rates as excess capacity flows back into core trades. Meanwhile, the US is refining its tariff regimes, easing duties on some food imports but keeping industrial goods firmly in scope—adding another layer of compliance complexity for shippers.
In Oceania, Australia heads into 2026 managing renewed inflation and rate‑hike risk, while New Zealand leans on monetary easing and new trade gains to stimulate recovery. For supply chain managers, the strategic takeaway is clear: resilience and flexibility remain the most effective tools in an uncertain freight environment. Diversified sourcing, stronger documentation and visibility, and contract structures that balance cost with reliability will be essential as the industry enters a year defined by both opportunity and instability.
Business Tip
Negotiate for flexibility, not just rates. With 2026 expected to bring overcapacity and volatile routing shifts, shippers should prioritise contracts that allow for rate reviews, mode changes, and flexible volumes. This is especially critical on Asia–Oceania lanes where service levels, congestion, and upstream supply constraints can shift fast.
KLN Oceania can help you discuss strategies and support you in negotiations.

Spotlight
PREPARE FOR 2026 WITH TOOLS THAT MATTER
OUR AI-POWERED TECHNOLOGY GIVES YOU CONTROL LIKE NEVER BEFORE
Dealing with Supply Chains can be a Challenge. But it doesn't have to be.
VBO provides end-to-end Supply Chain Control in a single place, allowing you to make data-driven decisions and optimize your entire supply chain, completely and seamlessly integrated with your ERP systems.

Market Trend
As 2025 draws to a close, the logistics and freight industry has navigated a roller‑coaster of shifting tides, from tariff upheavals and geopolitical disruptions to fleeting spot‑rate rallies and structural overcapacity. After 17 consecutive weeks of weakening freight indices, we’ve recently seen the Drewry World Container Index (WCI) register a 3 month‑on‑month bump, a gentle reminder that volatility remains the default state, not an anomaly.
Looking ahead, 2026 promises to be a year of contrasts. On the one hand, shrinking trade volumes and rising global capacity (including new vessel deliveries and container fleet growth) are expected to exert downward pressure on freight rates. On the other hand, continued uncertainty around trade policies, tariffs, and geopolitical flashpoints (including potential disruptions via strategic maritime routes) means shippers and forwarders must brace for unpredictability.
For logistics operators and supply‑chain managers, the strategic priority into 2026 should be resilience and flexibility. That means diversifying sourcing routes, strengthening compliance and documentation, balancing short‑term rate opportunities with longer‑term contract discipline, and building optionality into transport and warehousing strategies. In a world where “uncertainty is certain”, adaptability isn’t optional, it’s the margin between stability and disruption.
As of mid-November 2025, global freight markets are sitting in a familiar mix of soft demand, controlled capacity and congestion at key nodes. Asia’s major hubs continue to manage vessel bunching and yard pressure, while Europe remains in “artificial tightness” mode – demand is subdued, but congestion and inland equipment shortages are absorbing spare capacity and lengthening transit times. The World Container Index has just posted its first meaningful uptick after a 17-week decline, driven more by GRIs and blank sailings than any real rebound in global trade volumes.
On the Asia–Oceania lanes, conditions are nuanced. North East Asia to Australia has swung from early November strength into a sharp correction: mid-month GRIs have largely unravelled, with budget and mid-tier services discounting aggressively while premium loops hold a sizeable price gap, backed by backlog clearance and stronger reliability promises. South East Asia to Australia looks steadier on the surface – rates are broadly stable with a ~20% uplift on premium services – but effective supply is tighter than it appears, thanks to ongoing congestion in Singapore and Port Klang and carriers skipping Fremantle to protect rotations. Across Australia’s ports, disruption from weather, IT upgrades and intermittent industrial action remains manageable, but importers are still advised to allow 1–2 days of buffer on vessel arrivals and container availability.
Airfreight is entering the year-end peak in a state of “selective tightness”. Global tonnages have eased slightly week-on-week, yet average spot rates are edging up, reflecting lane-specific pressure rather than a broad boom. Space ex-China into Australia is tight but gradually improving as additional capacity comes online from mid-November, with South China via Singapore and Kuala Lumpur remaining the pinch point. For Australian shippers in particular, this is a window to secure uplift for genuinely critical cargo, refine prioritisation rules, and avoid using air as a blanket solution where lead-time buffers or sea–air combinations could achieve the same outcome at lower cost.
Intra-Asia Ocean Rates Climb in Traditional Year-End Surge
Intra-Asia container rates are rising into year-end, following their traditional seasonal pattern despite a highly volatile 2025 market. Drewry’s Intra-Asia Container Index shows average rates climbing around 4% between late October and mid-November to roughly USD 500+ per TEU, with some carriers filing GRIs of about USD 200 per TEU from 1 December on key China and North Asia–Southeast Asia corridors. The driver is classic: inventory replenishment and front-loading ahead of Lunar New Year in late January, as shippers pull volumes forward to protect against potential bottlenecks.
This rebound comes after a period of pronounced softness in Q3, when intra-Asia rates fell sharply and carriers were forced to cut capacity to stabilise yields. While demand has improved into Q4 and carriers are showing stronger discipline on blank sailings and capacity deployment, the underlying market remains choppy: intra-Asia components of the Shanghai Containerized Freight Index continue to show significant week-on-week swings, underscoring how fragile this rate strength could be if demand cools or competition intensifies.
Oceania angle
For Australia and New Zealand buyers sourcing from multiple Asian origins, the intra-Asia rate spike matters even if your final leg is Asia–Oceania. Higher feeder and regional rates feed into total origin costs, particularly where cargo moves via hub ports like Singapore, Port Klang, Busan or Hong Kong. If Lunar New Year front-loading intensifies, shippers may see pressure on pre-carriage, feeder connections and space into key consolidation hubs, even if mainline Asia–Oceania rates look stable. For time-sensitive SKUs, it’s worth reviewing PO timelines, locking in uplift windows with vendors and forwarders, and checking whether your routings rely heavily on corridors where GRIs are being applied.
Structural Overcapacity Looms in 2026 as Mega-Carrier Buying Sprees Peak
Industry analysts now see container shipping overcapacity in 2026 as effectively “baked in”, following aggressive box ship ordering and second-hand buying sprees by the largest carriers, led by MSC. Braemar describes MSC’s strategy as “buying power redefined”, with the carrier adding vast amounts of tonnage to reduce dependence on any single volatile trade. But with a multi-year orderbook of large mainline and feeder vessels still delivering into a cooling demand environment, analysts argue that significant structural overcapacity next year is “impossible to avoid”.
The Red Sea crisis and diversions via the Cape have temporarily absorbed much of the new capacity, masking the true extent of the supply surge. As geopolitical disruptions ease and schedules normalise, more of this tonnage will flow back into core east–west and north–south trades, intensifying competition and putting renewed downward pressure on freight rates—particularly on Asia–Europe and transatlantic corridors, where large vessels and independent services are already challenging alliance structures. Carriers are pushing for pre-emptive GRIs and FAK increases ahead of 2026, seeking to lock in higher contract levels before the market tilts decisively in shippers’ favour.
Oceania angle
For Australian and New Zealand shippers, a 2026 overcapacity scenario could mean more frequent promotions, sharper competition for volume and potentially lower base ocean rates on Asia–Oceania and connecting trades. However, greater capacity does not automatically guarantee reliability: blank sailings, service reshuffles and loops being added or withdrawn at short notice will remain common as carriers try to manage yields. The opportunity for Oceania importers is to use this window to negotiate more favourable multi-year deals, improve flexibility on routings and ports, and secure value-adds (free time, surcharges, digital tools) while carriers are keen to protect share. Close monitoring of alliance changes, MSC’s independent deployments and any consolidation of services into fewer, bigger ships calling AU/NZ will be essential for network planning.
Regional Carriers Move Back into the Red Sea as Big Liners Weigh a Cautious Return
Regional and niche carriers are steadily rebuilding container coverage in the Red Sea, even as most global mainline services continue to route via the Cape of Good Hope. Operators have added more loops linking China, the Gulf and Red Sea ports, while CMA CGM has pushed the furthest among the majors, running escorted test sailings through the Suez Canal – including at least one 16,000 TEU ship on a full round trip. These moves restore a clear transit-time advantage over Cape routings and signal that a broader reopening is now on the table, even if timing remains uncertain.
Market intelligence from Lloyd’s List, ING and others shows traffic through Bab el-Mandeb and the canal has been rising for several months, but still sits well below pre-crisis levels. Detours around the Cape are estimated to absorb roughly 6–7% of global container capacity; a large-scale return to Suez would release much of that, increasing effective supply. Analysts warn that the transition will likely be bumpy: an abrupt shortening of routes could trigger port congestion in Europe, the Med and connected trades, pushing rates up temporarily before additional capacity and newbuild deliveries intensify downward pressure on prices. For now, Maersk, MSC and other major carriers are signalling that any full-scale return will be slow and conditional on security, with more “testing the water” on backhaul legs rather than a big-bang switch.
For Oceania (Australia and New Zealand) importers and exporters, the implications include:
- Transit-time whiplash: A gradual shift back to Suez routings on Asia–Europe and related networks will change sailing times and connections at key hubs, with knock-on effects for schedules into and out of AU/NZ.
- Short-term turbulence, medium-term rate pressure: The initial return phase could bring congestion and disruption that lift rates temporarily, but once capacity is fully redeployed, the extra effective supply is likely to reinforce downward pressure on global freight rates.
- Contract and routing strategy: 2026 tenders should explicitly consider Red Sea scenarios—asking carriers how they plan to manage a return, what contingencies exist if security deteriorates again, and how they will handle congestion risk during any transition.
- Exposure mapping: Shippers with flows touching the Med, Red Sea or Gulf (imports or exports) need clear visibility of which services are already transiting Suez, which remain on Cape routings, and how quickly that mix could change.
- Risk diversification: Depending on a single Suez-reliant loop increases exposure; a mix of routings, carriers and hubs can help stabilise lead times if conditions in the Red Sea shift again.
Get Ready for a “Whiplash” of Port Congestion When Suez Reopens
When container services eventually swing back from the Cape of Good Hope to the shorter Suez Canal route—potentially around the new year—global networks are likely to see a fresh wave of port congestion, especially at major European gateways. Months of extended routings have stretched schedules and spread vessel arrivals; a sudden reset to shorter transit times risks bunching ships into already busy hubs and pushing quay and yard operations back to critical levels. Senior logistics executives are already flagging the need for more inland container storage and off-dock capacity to prevent terminals from seizing up when this shift happens.
Congestion risk is therefore less about “problem solved once the Red Sea calms down” and more about congestion moving and changing shape. Terminals will need to manage compressed arrival windows, heavier transhipment flows, and a surge of equipment repositioning. Inland depots, barge and rail links, and better visibility on container movements become key levers to keep boxes flowing away from quays and avoid the kind of yard density that paralysed ports in 2021–22. New capacity in eastern Mediterranean hubs—including expanded facilities in Egypt—may relieve some pressure but is unlikely to absorb the full shock if large volumes revert to Suez-based routings at once.
For Australian and New Zealand supply chains, the implications include:
- Europe-bound exports: Schedule reshuffles and delays for cargo moving to Europe on Suez-linked services.
- Indirect congestion risk: Asian exports to Europe may compete for space and equipment, diverting container assets away from Oceania lanes.
- Equipment and reliability: Greater risk of container shortages, last-minute rotation changes and more volatile transit times into AU/NZ.
- Lead-time planning: Need to build additional buffer into lead times for any SKUs touching Europe or the Mediterranean.
- Network strategy: Value in reviewing routings, inland storage and deconsolidation options with logistics partners ahead of Q1–Q2.
Asia–Europe Spot Rates Hold Firm While Transpacific Struggles for Cargo
Mid-November FAK (freight all kinds) increases have kept Asia–Europe spot rates on a firm footing, even as broader container indices hint at softening momentum. According to Loadstar coverage based on data from Xeneta, Drewry and other market trackers, Shanghai–North Europe rates have continued to edge up week-on-week, supported by earlier GRIs and relatively tight capacity management. In contrast, spot prices from Asia to the US—particularly the west coast—remain under pressure as carriers deploy more tonnage and compete aggressively to fill ships.
This divergence reflects differing supply–demand dynamics across the main east–west trades. Asia–Europe continues to benefit from capacity still tied up in extended routings linked to the Red Sea crisis and cautious capacity deployment, while the transpacific is seeing more vessels and services chasing a slower-than-hoped-for cargo recovery. Market commentary suggests that, unless demand improves into Q1, carriers on the transpacific may need to rely on further blank sailings or service reshuffles to stop rates from eroding further, even as they attempt to hold the line on FAK levels into annual contract negotiations.
Oceania angle
For Australian and New Zealand shippers, the key signal is that Asia–Europe still looks relatively tight compared with the US trades. That matters for Oceania because carriers’ network decisions on the big east–west corridors influence how much capacity, equipment and schedule reliability ultimately reaches our region. If Asia–Europe continues to command stronger yields, carriers may prioritise those loops when juggling vessels and blankings, which can indirectly affect space, sailing frequency and rate trends on Asia–Oceania legs. Staying close to carrier and forwarder updates on GRIs, blank sailings and service changes—especially where your cargo relies on the same origin ports and hubs used for Asia–Europe or transpac—is essential when planning 2026 contracts and peak season inventory strategies.
Port Congestion Re-Emerges as a Key Risk for Global Supply Chains
Recent analysis from maritime intelligence firm Kpler and industry media highlights that congestion at major global ports has again become a significant operational challenge for ocean supply chains. Extended vessel waiting times at key hubs are reducing effective fleet capacity, tying up ships at anchor and creating the risk of renewed upward pressure on freight rates.
Port congestion today looks different from the 2021–22 crisis: the pressure is more uneven and often driven by local factors such as labour disputes, infrastructure bottlenecks, weather events, and high yard utilisation at individual terminals. Northern European hubs like Rotterdam and Antwerp have faced recurring disruption from strikes and operational constraints, while other regions are seeing intermittent delays as volumes shift and larger vessels strain port capacity.
Kpler’s broader guidance underlines that congestion directly affects schedule reliability, inventory positioning and total transport cost. Longer berth waiting times, rising container dwell and yard density above 75–80% translate into higher demurrage, detention and charter costs, which eventually feed into freight rates. Shippers that track congestion data and adjust routings or carrier mix early are better positioned to avoid the sharpest impacts when bottlenecks escalate.
Oceania angle
For Australia and New Zealand, congestion at foreign hubs is often a “hidden” risk: even if local ports are operating relatively smoothly, delays at transhipment gateways in Europe, Asia or Africa can absorb vessel capacity and destabilise global schedules. That can mean longer and less predictable transit times into Oceania, tighter space on key Asia–Oceania legs and renewed upward pressure on ocean rates and surcharges. Regularly monitoring congestion advisories, reviewing routings that rely on known hotspots, and building a few extra days of buffer into ETAs for critical SKUs will be important risk-management steps for peak season planning and contract discussions with carriers and forwarders.
US Eases Tariffs on Key Food Imports, But Industrial Goods Still Carry the Burden
In mid-November, the White House moved to soften parts of its “reciprocal” or “Liberation Day” tariff regime by exempting a broad range of consumer agricultural staples from additional duties. A new executive order narrowed the scope of the universal 10% reciprocal tariff for certain food products that are either not produced, or only minimally produced, in the US—aimed squarely at easing cost-of-living pressure for households while keeping the overall framework intact.
Within days, a separate order rolled back the steep 40% surcharge that had been placed on Brazilian food imports earlier in the year, including beef, coffee, cocoa, fruit, nuts and juices. That rollback is retroactive to mid-November, with refunds due on duties already collected, and comes alongside new framework trade deals with several Latin American and European partners. Together, these moves signal a more pragmatic, price-sensitive approach to food imports, even as higher tariffs remain in force for many industrial and manufactured goods.
For Oceania (Australia and New Zealand) importers, the implications include:
- Food vs industrial split: US policy is clearly more willing to relax tariffs on consumer food staples than on industrial and manufactured goods, which could shape future negotiations and product-level opportunities.
- Indirect demand and pricing effects: Lower US tariffs on Brazilian and other agricultural exports may redirect food trade flows and influence global price benchmarks, including for products competing with AU/NZ origins.
- Compliance complexity: Rapid, product-specific tariff changes reinforce the need for tight HS classification, origin management and up-to-date advisory support when trading with or via the US.
- Signal for future carve-outs: The easing on food suggests further targeted exemptions are possible where tariffs are seen to fuel inflation—useful context for AU/NZ exporters lobbying on specific product lines.
Developments in Oceania
Australia’s Economic Outlook
As of early December 2025, Australia’s economy is growing, but with clear signs of overheating that are complicating the interest rate outlook. GDP rose by around 0.4% in the September quarter, leaving annual growth modest but still positive and broadly in line with the Reserve Bank of Australia’s (RBA) expectation that the economy would be expanding at about 2% year-on-year by the end of 2025. While growth is not especially strong in per-capita terms, domestic demand has remained more resilient than many forecasters anticipated.
The main concern for policymakers now is the inflation pulse heading into 2026. After earlier progress, headline inflation picked up again, with October annual CPI running at about 3.8% and underlying (core) inflation near 3.3%, above the RBA’s 2–3% target band. This has been driven in part by strong household spending: in October, nominal household outlays surged 1.3% month-on-month – the largest rise in nearly two years – and 5.6% over the year, helped by sales events, rising wealth and improved disposable income. That combination of faster spending, firmer inflation and still-tight labour conditions has pushed market pricing toward the possibility of a rate hike in 2026, rather than further cuts.
For now, the RBA’s cash rate remains at 3.60%, unchanged since August, with the Board heading into its 9 December meeting under growing pressure to sound more hawkish. The Council of Financial Regulators’ December statement also flagged that, while the financial system remains resilient, regulators are watching asset valuations, credit conditions and global tariff risks closely. Together, these developments suggest that, as 2025 closes, Australia is operating near its “speed limit”: growth is adequate, but renewed inflation and strong domestic demand are limiting scope for near-term rate relief.
New Zealand’s Economic Developments
New Zealand enters December 2025 with monetary policy clearly in easing territory but edging toward a pause. In late November, the Reserve Bank of New Zealand (RBNZ) cut the Official Cash Rate (OCR) by a further 25 basis points to 2.25%, its lowest level since mid-2022. This move followed a series of larger cuts over the previous year and was framed as likely the last in the current cycle: policymakers noted that the decision had been finely balanced between holding and cutting, and signalled that further easing was not their central expectation.
The RBNZ judges that significant spare capacity still exists in the economy, even as early signs of a pick-up are emerging. Inflation is currently around 3% year-on-year – the top of the 1–3% target band – but is expected to fall back toward 2% by mid-2026 as weaker demand and previous policy easing work through the system. Lower interest rates are intended to support hiring, reduce unemployment and boost household cash flow via lower mortgage repayments, helping to stabilise activity after a prolonged, shallow downturn.
On the policy front, the New Zealand Government has also moved to support the tradable sector and broader growth. In late November, the United States announced it would remove additional tariffs on about NZ$1.25 billion of New Zealand agricultural exports – including beef, offal and kiwifruit – a decision Wellington welcomed as a meaningful step toward normalising bilateral trade. At the same time, the government has launched a new initiative to tackle non-tariff barriers affecting roughly NZ$600 million in exports, aiming to give firms faster and easier access to overseas markets. These measures, combined with accommodative monetary policy, position New Zealand for a gradual, externally-driven recovery into 2026.
Trade & Industry Highlights
Globally, world trade has so far proven more resilient to the tariff hikes seen under the current U.S. administration than many had feared. Analysts note that while headline tariff lines have risen, the effective tariff rate has increased far less – to around 10% by September 2025 – because many importers have actively shifted sourcing away from the most heavily taxed products. For exporters in Australia and New Zealand, this means the environment is still challenging but not uniformly hostile: trade flows are being rerouted and repriced rather than collapsing.
Within New Zealand, the government’s late-2025 push on non-tariff barrier reduction and the partial rollback of U.S. tariffs should support key agri-food and horticulture exports, which are central to Oceania–Asia supply chains. In Australia, the picture is more domestically driven: stronger household spending, firmer commodity prices and a buoyant equity market – with the ASX 200 supported by mining names amid higher copper and iron ore prices – point to robust underlying demand, even as policy debate shifts from rate cuts to the risk of renewed tightening.
Taken together, December 2025 closes the year with a mixed but clearer backdrop for Oceania: Australia is wrestling with the trade-off between growth and inflation as it approaches a critical RBA decision, while New Zealand is nearing the end of its easing cycle and leaning on trade policy wins to restart momentum into 2026.
Ocean Freight Updates

- Carriers' booking utilization sits at 95%-100% to both AU and NZ, with irregular blank sailings and cargo rolling.
Some carriers expect to remain full at least until end of December —book in advance.
- COSCO shipments to AU Transshipment via Singapore keep waiting times around 3-4 weeks in SIN, under their FIFO operational policy.
- Blank Sailings are expected with an average 8% capacity cut for the rest of December 2025.
Why BCOs Need to Put Reliability and Service Ahead of Ocean Freight Rates
As 2026 contract talks get underway, the balance of power in ocean freight has shifted. Spot markets are soft, carriers are under pressure, and shippers have more room to negotiate than they’ve had in years. But simply driving rates down is a short-sighted win if it comes at the cost of schedule reliability, transparency over surcharges, and day-to-day service quality. Contracts built solely around the lowest price per TEU can quickly unravel when blank sailings, port congestion, or tariff shocks hit, leaving BCOs exposed to rolled cargo, last-minute surcharges and inconsistent communication.
A growing body of contract experience from 2023–25 shows that the shippers who fared best were those that treated their carrier and forwarder relationships as long-term partnerships, not annual price auctions. That means prioritising measurable reliability (on-time performance, rolled-cargo thresholds), clear visibility of allocations and contingencies, robust EDI/API data flows, and responsive customer service—then using rate negotiations to support that framework, rather than define it. In a market still shaped by geopolitical risk, alliance reshuffles, and recurring service disruptions, resilience and transparency are now as valuable as headline rate savings.
For Oceania (Australia and New Zealand) importers and exporters, the implications include:
- Contract strategy reset: 2026 tenders are a chance to bake in service KPIs—on-time performance, roll-rate caps, dispute resolution timelines—rather than focusing only on base rates.
- Visibility as a bargaining chip: Data quality, milestone visibility and integration with platforms like VBO or KLN Online should be treated as core deliverables in contract negotiations, not “nice to have” extras.
- Risk diversification: Over-reliance on a single carrier or service loop into AU/NZ increases exposure to blank sailings and schedule changes; a balanced mix of partners and routings reduces that risk.
- Value in partnerships: Forwarders and carriers willing to share forecasts, capacity plans and contingency playbooks are more valuable than those offering the lowest nominal rate with limited transparency.
- Long-term leverage: Using today’s softer market to secure multi-year terms around reliability and service can protect Oceania supply chains when the rate cycle tightens again.
GRIs Push Spot Rates Up on Paper – But Discounts Reveal a Softer Market
Early November’s general rate increases (GRIs) delivered a short run of spot-rate gains on the main east–west trades. Indices such as the WCI and FBX showed Asia–US and Asia–Europe benchmarks ticking higher after 1 November, marking the fourth consecutive week of modest recovery from mid-year lows. However, the uplift was uneven across lanes and came against a backdrop of weak underlying demand and growing capacity, with rates still far below historic peaks.
Beneath the headline numbers, a clear two-tier market has emerged. On the China–US west coast, posted FAK levels after the 1 November GRI moved into roughly the US$2,900–3,100/FEU band, but widely available “specials” cleared nearer US$1,900–2,100/FEU for named near-term sailings—classic discounting to backfill half-empty ships once the GRI optics were secured. Similar patterns appeared on the east coast, with nominal rate hikes quickly eroded by targeted discounts. By mid- to late November, daily transpacific prices had surrendered most of the GRI gains, while Asia–Europe levels proved stickier thanks to heavier blank-sailing campaigns and tighter capacity management.
The result is a market where index readings and filed GRIs can overstate actual buying conditions. Carriers are trying to defend yield and maintain a narrative of rising rates, yet competitive pressure and soft demand force them to negotiate down on specific vessels and weeks. For shippers, it reinforces the need to distinguish between “headline” and “transactable” pricing, and to expect continued volatility as new capacity arrives and seasonal demand fades.
For Oceania (Australia and New Zealand) importers and exporters, the implications include:
- Two-tier rate reality: GRIs and higher FAK levels on Asia–US and Asia–Europe are a reminder that similar tactics can appear on Asia–Oceania routes—headline increases, with room to negotiate depending on load factors and timing.
- Opportunistic discounts: Carriers are using short booking windows and “named sailing” specials to backfill capacity; AU/NZ shippers who monitor the market weekly and move quickly on genuine specials are better placed to benefit.
- Capacity and blank sailings: Global blank-sailing programmes remain concentrated on Asia–Europe and transpacific corridors, but around 8% of Asia–Australia sailings were also blanked through October–November, meaning GRIs can combine with capacity cuts to keep local rates firmer than global sentiment suggests.
- Contract design vs spot exposure: With GRIs proving fragile on some lanes, there’s a case for blending shorter-term contracts, index-linked deals and opportunistic spot buys—rather than locking everything in at early-GRI peaks or relying purely on volatile spot.
- Need for granular benchmarking: Comparing index values with actual offers on your lanes (and understanding how much discount is “normal”) becomes a key part of 2026 tender strategy for Oceania-based importers and exporters.
Sri Lanka – Colombo Port Operations Resuming After Cyclone Ditwah
Colombo Port has fully resumed operations following the severe adverse weather caused by Cyclone Ditwah.
Port operations were completely suspended from 26 November (09:00 hrs) to 29 November (08:00 hrs) due to unsafe conditions.
As of 30 November 2025, weather conditions in the Colombo region have stabilised, and both navigation and terminal operations have returned to normal.
Expected Impact on Operations
Despite the resumption of full port activity, customers should note:
- Berthing delays of up to 3 days are expected as terminals clear accumulated vessel backlogs.
- CICT terminal is likely to face the most pressure due to a higher concentration of scheduled vessel calls.
Summary of Cyclone Impact
Cyclone Ditwah and its indirect effects resulted in:
- Extremely heavy rainfall and flooding across Colombo
- Strong winds preventing safe vessel berthing
- High sea swells and rough conditions across Western & Southern maritime regions
- Significantly reduced visibility and unsafe working conditions
All container handling, berthing, loading/unloading, and transshipment activities were halted from 26–29 November 2025.
Impact on Sailing Schedules
Due to the multi-day shutdown:
- Several vessels calling Colombo are expected to face delays
- Some services may undergo schedule omissions or blank sailings
- Transshipment cargo via Colombo may experience longer transit times
Misconnections are possible due to congestion and vessel rollover
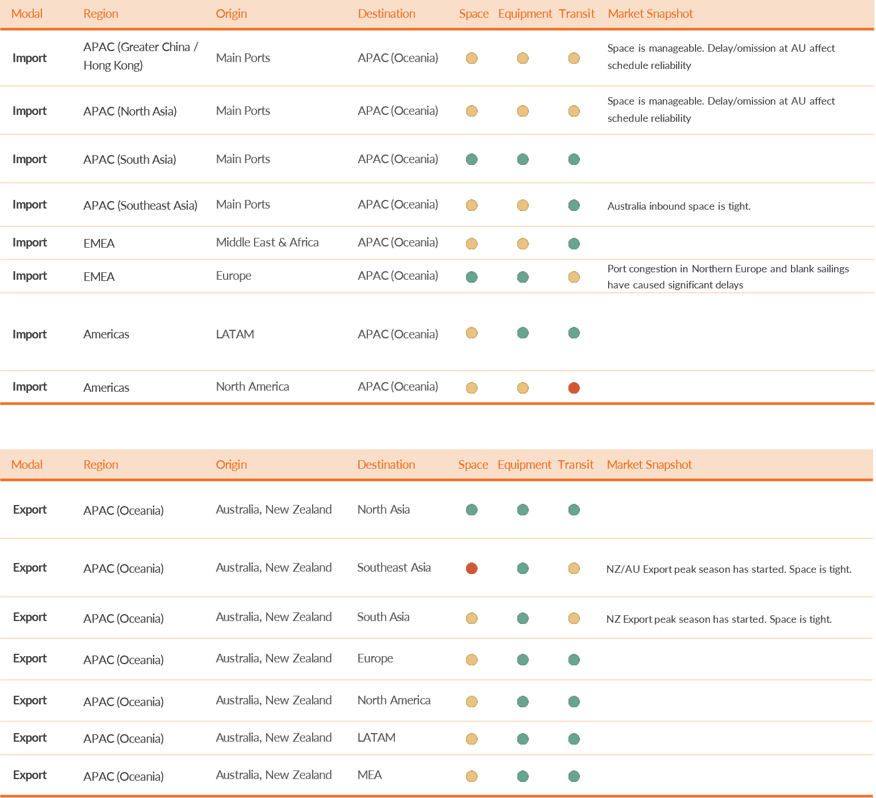
Ocean Freight Snapshot (December 2025)
Check our snapshot for a quick glance at space, rate, equipment, and transit times for Oceania.

Air Freight Updates
Black Friday & Cyber Monday E-Commerce Boom Leaves Many European Hauliers On the Sidelines
Recent Black Friday and Cyber Monday peaks in Europe have underlined a clear divide in who benefits from the e-commerce surge. Online sales and parcel volumes have grown strongly, but most of the upside is being captured by integrators, parcel carriers and retailers’ own dedicated middle- and last-mile networks. Traditional road hauliers handling full-truckload and groupage work are seeing only limited additional demand from these events.
At the same time, Europe’s road freight market continues to struggle with weak underlying demand, patchy capacity and stubbornly high operating costs. Benchmark data and market commentary point to flat or declining freight rates against rising pressure from wages, equipment and regulatory compliance. This combination is squeezing margins and limiting hauliers’ ability to invest, diversify or expand—even when headline retail events briefly lift volumes in parts of the network.
For Oceania (Australia and New Zealand) importers, the implications include:
- Limited spot-rate relief: Persistent cost pressure means European haulage rates are unlikely to fall simply because e-commerce keeps growing.
- Service stability risk: Financially stressed operators may focus on core lanes and large accounts, reducing flexibility or reliability on secondary routes linked to AU/NZ flows.
- E-commerce-skewed capacity: Additional BFCM capacity is concentrated in parcel and express networks, not necessarily in the FTL/LTL capacity that supports traditional B2B supply chains.
- Importance of integrated partners: Working with logistics partners that can combine haulage, parcel and contract logistics solutions becomes more valuable as peak demand patterns evolve.
South-East Asia Airfreight Surges as China+1 Shift Redraws Trade Flows
Explosive growth in airfreight demand out of South-East Asia is reshaping regional and long-haul networks. As more global manufacturers adopt a China+1 sourcing model, production and export volumes are moving into markets such as Thailand, Malaysia, Vietnam, Indonesia and the Philippines. That shift is driving higher yields on key lanes, with some South-East Asian origins now commanding stronger transpacific rates than traditional powerhouses like mainland China and Vietnam. Carriers and forwarders are responding with additional capacity, new freighter routes and more sophisticated hub strategies centred on regional gateways.
The boom is also attracting fresh investment. Major players including Etihad Cargo, Rhenus, Morrison Express and specialist air cargo intermediaries are expanding their presence across the region, building cross-border e-commerce capabilities and fine-tuning multimodal solutions that link sea, air and last mile. At the same time, the environment remains dynamic: competition for slots at key airports, infrastructure constraints and weather-related disruptions are putting a premium on reliable partners, flexible routing and strong data visibility. Overall, South-East Asia is consolidating its role as a critical airfreight engine for global supply chains, not just a back-up to China.
For Oceania (Australia and New Zealand) importers and exporters, the implications include:
- New sourcing and uplift options: Expanding production and air capacity in South-East Asia widens choice for time-sensitive SKUs, including fashion, electronics, spares and e-commerce replenishment.
- Rate and capacity competition: Strong demand and high yields on long-haul lanes (e.g. to North America and Europe) can compete with Oceania for space ex-SEA, particularly in peak periods.
- Hub strategy rethink: Growing use of South-East Asian hubs for sea–air and air–sea solutions creates opportunities to redesign routings for speed or resilience on Oceania lanes.
- Partner selection: With multiple new services and products coming to market, choosing forwarders and carriers with strong local networks and contingency options in SEA becomes more important.
E-Commerce Keeps Air Cargo Booming – Barriers Shift Flows, Not Demand
Global air cargo is increasingly being shaped by cross-border e-commerce, which continues to grow even as governments tighten rules on low-value shipments, raise tariffs and lengthen customs processes. Data from IATA, TIACA and market analysts shows that e-commerce already accounts for around 20% of global air cargo volumes and is on track to reach about 30% by 2027, with related tonnages expected to roughly double over the next decade. Overall air cargo demand in 2025 is running at roughly 3–4% growth year-on-year, and a significant share of that resilience is attributed to online retail and marketplace flows, particularly out of Asia-Pacific.
Rather than slowing e-commerce, regulatory and cost barriers are mainly redirecting how and where these flows move. The removal or tightening of de minimis exemptions, new parcel-focused tariffs, and stricter security checks have cut volumes on some lanes—most notably China–US—while encouraging alternative strategies such as sea–air routings, overseas warehousing, and more regional fulfilment hubs. Integrators, postal operators, freighter airlines and forwarders are responding with dedicated e-commerce capacity, new small-parcel products and deeper integration with platforms and marketplaces. In effect, e-commerce behaves “like water”: when one channel is blocked or becomes more expensive, flows find new routes through different gateways, carriers and service combinations.
For Oceania (Australia and New Zealand) importers and exporters, the implications include:
- Persistent peak pressure: E-commerce-driven demand keeps air cargo markets tighter around key peaks (BFCM, Lunar New Year, major sales), which can crowd out traditional B2B uplift and push up rates into and out of Oceania.
- Asia-Pacific as a growth engine: With Asia-Pacific now leading global air cargo growth and e-commerce a key driver, hubs such as Hong Kong, Singapore and other regional gateways will play an even bigger role in AU/NZ air networks.
- Network and inventory strategy: Cross-border e-commerce models (including near-market warehousing and returns centres) create opportunities to redesign fulfilment and returns flows for AU/NZ consumers and brands, but also demand tighter SLAs and faster cut-off times.
- Risk of regulatory whiplash: Sudden changes to de minimis rules or parcel-specific tariffs in the US, EU or Asia can quickly shift cost structures and routings, making digital customs data quality and regulatory monitoring critical.
- Partner selection: Forwarders and carriers with proven e-commerce capabilities—consolidation, express, returns management, and strong IT integration—will be better placed to protect service levels for Oceania shippers as e-commerce volumes keep reshaping capacity.
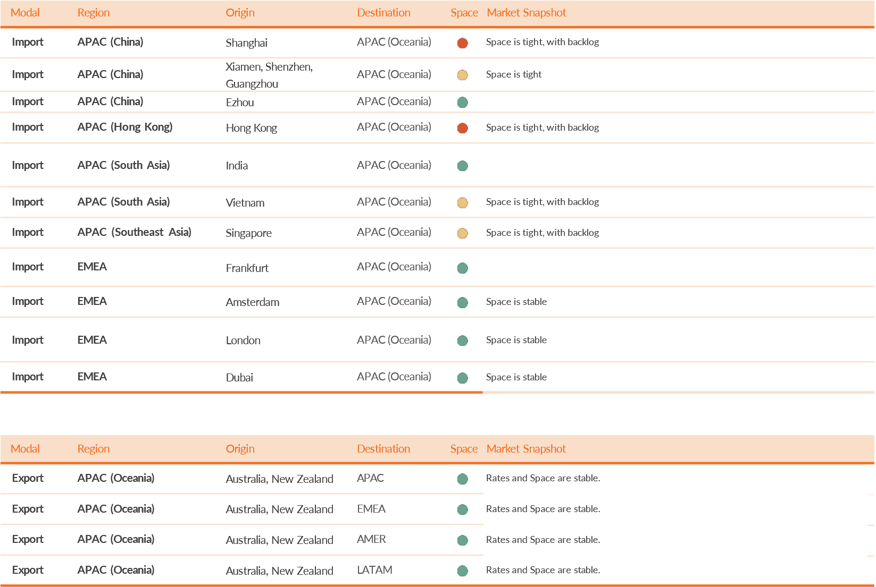
Air Freight Snapshot (December 2025)
Customs, Inland Transport, Terminal and Regulation Updates

India–New Zealand Trade Deal Edges Closer, Opening Doors for NZ Exporters
Negotiations for a comprehensive India–New Zealand free trade agreement (FTA) have moved into an advanced phase, with multiple rounds of talks completed and high-level visits in both directions during 2025. India’s commerce and industry minister Piyush Goyal and New Zealand trade minister Todd McClay have both publicly framed the deal as a “balanced” partnership that could significantly expand two-way trade over the coming decade, particularly in sectors such as agriculture, critical minerals, pharmaceuticals, education and tourism. Current merchandise trade is still relatively modest, but has grown strongly over the past two years, underlining the headroom for further expansion.
For New Zealand exporters, the most immediate interest lies in improved market access for key primary sectors. India is already an important buyer of New Zealand dairy ingredients, meat, forestry products, horticulture and processed foods, but a patchwork of tariffs and non-tariff barriers has limited the pace of growth. A modern FTA is expected to tackle at least part of this, with a focus on selected food and fibre categories, niche dairy lines, value-added foods, and services such as education and tourism. At the same time, India has been clear that politically sensitive areas such as broad dairy liberalisation and MSME protection will be handled cautiously, so expectations for “across-the-board” tariff removal need to stay realistic.
From a logistics and trade-lane perspective, any uplift in India–New Zealand flows is likely to support more frequent services and stronger reefer demand on Asia–Oceania loops and via key hubs such as Singapore and Colombo. As volumes build, competition between carriers and forwarders on India–Oceania corridors could increase, creating new opportunities for integrated cold chain, consolidation and value-added services around meat, dairy, fruit and high-value manufactured exports.
For Oceania (Australia and New Zealand) exporters and importers, the implications include:
- NZ export upside: A successful FTA would improve tariff treatment and regulatory predictability for New Zealand’s core export verticals into India—especially reefer cargoes such as meat, dairy ingredients, fruit and chilled foods.
- Benchmark for Australia: Deeper India–NZ ties raise the bar for how Australian exporters use and position their own agreements with India, as buyers increasingly benchmark Oceania suppliers against each other on price, quality and reliability.
- Reefer and capacity planning: Stronger New Zealand–India trade could tighten reefer equipment and vessel space around shared hubs and peak seasons, with potential knock-on effects for other Oceania trades that rely on the same services.
- Sourcing opportunities: As India streamlines customs and trade procedures, AU/NZ importers sourcing from Indian manufacturers may see smoother documentation, more frequent sailings and new options for supplier diversification.
- Need for tariff intelligence: Product- and chapter-specific outcomes will matter; exporters and importers will need up-to-date tariff mapping and scenario planning to understand where the deal genuinely moves the needle.
KiwiRail Tightens Grip on Metroport and Signals Capacity Boost for 2026
KiwiRail has now taken full commercial and operational control of the Metroport Auckland rail service, with the new structure effective from 1 December 2025. Day-to-day processes for customers remain largely unchanged: bookings continue to be made through shipping lines, Metroport service handling and gate operations are the same, and PortConnect will keep providing visibility over cargo movements. For now, Port of Tauranga will still invoice ancillary charges, with that responsibility expected to migrate to KiwiRail around mid-2026.
From February 2026, Metroport capacity is planned to increase from around 54 to 72–78 services per week as KiwiRail moves to optimise its “Golden Triangle” network between Auckland, Hamilton and Tauranga. The Southdown facility currently offers about 5,000 TEU capacity over 15 hectares, with scope to grow throughput by roughly 30% through targeted infrastructure changes—supporting an annualised range of 350,000–400,000 TEU. KiwiRail also outlined a new Metroport Link product, due to launch in February 2026, to handle empty container flows at a lower VBS charge than standard moves, with trials planned alongside selected shipping lines.
A key short-term consideration is the planned block of line between Port of Auckland and the main rail network from 27 December 2025 to 18 January 2026. During this period there will be no rail services on that section, with road bridging between Southdown and Hamilton used to maintain connectivity. Customers were strongly encouraged to plan bookings well in advance to manage the disruption.
For New Zealand-based importers and exporters using Metroport, the implications include:
- Continuity with change: Commercial responsibility now sits with KiwiRail, but booking processes, gate operations and PortConnect tracking remain familiar for customers.
- More rail options in 2026: The planned lift to 72–78 services per week should provide more flexibility and resilience for Auckland–Tauranga moves, particularly around peak periods.
- Dedicated solution for empties: The Metroport Link product is designed to improve the flow of empty containers at a lower VBS charge, which could help reduce repositioning costs and yard congestion.
- Holiday-period disruption: The late-December to mid-January block of line will require early planning of export and import rail slots, with road bridging adding complexity and potential lead-time pressure.
- Longer-term network optimisation: KiwiRail’s focus on the Golden Triangle suggests further tweaks to service patterns and capacity over time, making it important to keep routings and delivery cut-offs under regular review.
Why Partner with KLN
Selecting KLN Oceania as your trusted partner isn't just a choice—it's a strategic move towards ensuring your success. Our commitment to excellence is not just a promise; it's a guarantee. With a global network that's both vast and meticulously managed, we stand head and shoulders above the competition. This means you benefit directly from unparalleled service quality, ensuring your supply chain needs are met with precision, efficiency, and minimal hassle.
Are you ready to elevate your logistics game and experience seamless support tailored to your unique needs? Let's discuss how we can bring unparalleled value to your business.
